The unsatisfactory nature of our factory statistics, as demonstrated above, has compelled us to resort to more complex calculations in order to determine the development of large-scale machine industry in Russia since the Reform. We have selected data for 1866, 1879, 1890 and 1894-95 on the largest factories, namely, those with 100 and more workers per establishment.[1] Outside workers are strictly separated only in the data of the List for 1894-95; hence, the data for previous years (particularly 1866 and 1879) may still be somewhat exaggerated, notwithstanding the corrections referred to in the footnote.
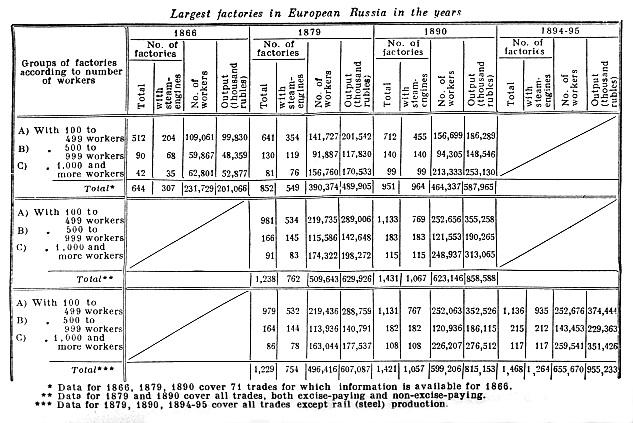
We give the returns on these largest factories (p. 510).
Let us commence our analysis of this table with the data for the years 1866, 1879 and 1890. The total number of large factories changed during these years as follows: 644, 852, 951, or in percentages: 100, 132, 147. In the course of 24 years the number of large factories increased, consequently, by nearly fifty per cent. Moreover, if we take the data for the different categories of large factories, we shall see that the larger the factories, the faster their number grows (A: 512, 641, 712 factories; B: 90, 130, 140; C: 42, 81, 99). This indicates a growing concentration of production.
The number of mechanised establishments grows more rapidly than the total number of factories; in percentages as follows: 100, 178, 226. An increasing number of large factories introduce steam-engines. The larger the factories, the greater the number of mechanised establishments among them; if we calculate the percentage of these establishments to the total number of factories in the given category, we obtain the following: A) 39%, 53%, 63%; B) 75%, 91%, 100%; C) 83%, 94%, 100%. The employment of steam-engines is closely bound up with the expansion of the volume of output, with the expansion of co-operation in production.
The number of workers in all large factories changed in percentages as follows: 100, 168, 200. During the 24 years the number of workers doubled, i.e., exceeded the increase in the total number of “factory workers.” The average number of workers per large factory was by years: 359, 458, 488, and by categories: A) 213, 221, 220; B) 665, 706, 673; C) 1,495, 1,935, 2,154. An increasing number of workers are thus being concentrated in the largest factories. In 1866, factories with 1,000 workers and over employed 27% of the total number of workers in large factories; in 1879, 40%; in 1890, 46%.
The change in the output of all large factories expressed in percentages will be: 100, 243, 292; and by categories: A) 100, 201, 187; B) 100, 245, 308; C) 100, 323, 479. Hence, the volume of output of all large factories increased almost threefold, and the larger the factory, the more rapid the increase. But if we compare the productivity of labour for each separate year according to the different categories, we shall get a somewhat different picture. The average output per worker in all large factories will be: 866 rubles, 1,250, 1,260; and by categories: A) 901, 1,410, 1,191; B) 800, 1,282, 1,574; C) 841, 1,082, 1,188. Thus, for each separate year we observe no increase in output (per worker) as we pass from the bottom category to the top. This is because the various categories include, in unequal proportions, factories in industries using raw materials of different value and obtaining, therefore, an annual output per worker of different value.[2]
We do not think it worth while to examine in equal detail the data for the years 1879-1890 and for the years 1879-1890-1894-1895, since this would mean repeating all that has been said above for somewhat different percentages.
Latterly, the Collection of Factory Inspectors’ Reports has supplied data on the distribution of factories and works into groups according to the number of workers employed. Here are the data for 1903:
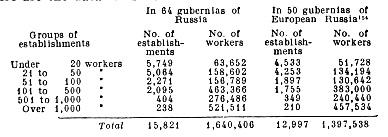
Russia[9]
A comparison of these with the afore-cited data will involve a certain inaccuracy, a slight one, it is true. At all events, they show that the number of large factories (those with over 99 or over 100 workers) and the number of workers employed in them are rapidly increasing. The concentration of workers and, consequently, of production, also increases in the largest of these large factories.
Comparing the data on the large factories with those on all “factories and works” given in our of official statistics, we see that in 1879 the large factories, constituting 4.4% of all “factories and works” concentrated 66.8% of the total number of factory workers and 54.8% of the total output. In 1890 they constituted 6.7% of the total number of “factories and works,” and concentrated 71.1% of all factory workers and 57.2% of the total output. In 1894-95 they constituted 10.1% of all “factories and works,” and concentrated 74% of all factory workers and 70.8% of the total output. In 1903, the large factories in European Russia, those with over 100 workers, constituted 17% of the total number of factories and works and concentrated 76.6% of the total number of factory workers.[3] Thus, the large, mostly steam-powered, factories, despite their small numbers, concentrate an overwhelming and ever-growing proportion of the workers and output of all “factories and works.” The tremendous rapidity with which these large factories have been growing in the post-Reform period has already been noted. Let us now cite data on the equally large enterprises in the mining industry.[4]
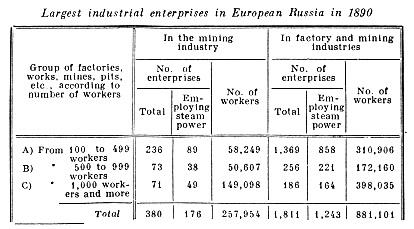
In the mining industry the concentration of workers in large enterprises is still greater (although the percentage of enterprises employing steam-engines is smaller); 258,000 workers out of 305,000, i.e., 84.5%, are concentrated in enterprises with 100 and more workers; almost half of the mine workers (145,000 out of 305,000) are employed in a few very large establishments each employing 1,000 and more workers. And of the total number of factory and mining workers in European Russia (1,180,000 in 1890), three-fourths (74.6%) are concentrated in enterprises employing 100 workers and over; nearly half (570,000 out of 1,180,000) are concentrated in enterprises each employing 500 and more workers.[5]
We think it worth while to deal here with the question raised by Mr. N.–on concerning a “slowing down” of the development of capitalism and of the growth of the “factory population” in the period of 1880-1890, as compared with that of 1865-1880.[6] From this remarkable discovery Mr. N.–on contrived, thanks to the original logic that distinguishes him, to draw the conclusion that “the facts fully confirm” the assertion made in Sketches that “capitalism, after reaching certain limits of its development, effects a shrinkage of its own home market.”—Firstly, it is absurd to argue that a “slowing down in the rate of increase” indicates a shrinkage of the home market. If the number of factory workers is growing faster than the population (and this is precisely the case according to Mr. N.–on’s own data; an increase between 1880 and 1890 of 25%), this shows that the population is being diverted from agriculture and that the home market is growing even for articles of personal consumption. (We say nothing of the market for means of production.) Secondly, a “decline in the growth,” expressed in percentages always has to take place in a capitalist country at a certain stage of development, for small magnitudes always grow faster, in percentages, than big ones. The only deduction one can draw from the fact that the initial steps in the development of capitalism are particularly rapid is that the young country is striving to overtake the older ones. It is wrong, however, to take the percentage increase in the initial period as a standard for subsequent periods. Thirdly, the fact itself of a “decline in the growth” is not proved at all by comparing the periods taken by Mr. N.–on. The development of capitalist industry cannot proceed except in cycles; therefore, to compare different periods, one must take data for a whole number of years,[7] so that the particularly prosperous, boom years and the slump years may stand out distinctly. Mr. N.–on did not do this and slipped into profound error, for he overlooked the fact that the year 1880 was a high boom year. Moreover, Mr. N.–on did not even hesitate to “concoct” the opposite assertion. “We must also note,” he argues, “that the intervening year (between 1865 and 1890) of 1880 was a year of crop failure, so that the number of workers registered in that year was below the normal”!! (ibid., pp. 103-104). Mr. N.–on had only to glance at the text of the very publication from which he plucked the figures for 1880 (Directory, 3rd edition), to read there that 1880 was marked by a “spurt” in industry, particularly in leather and machine building (p. IV), and that this was due to the enhanced demand for goods after the war and to increased government orders. It is sufficient to look through the Directory for 1879 to get a clear idea of the extent of this spurt.[8] But Mr. N.–on does not hesitate completely to distort the facts to suit his romantic theory.
[1] Sources: The Ministry of Finance Yearbook, I (data only for 71 trades)- Directories, first and third editions—data for all trades, as well as those in the List ; but for a comparison of the data in the List and in the Directory, the manufacture of rails must be omitted from the trades given in the latter establishments for which home workers were included among the factory workers are omitted. In some cases the inclusion of home workers is specifically indicated in footnotes in the publications mentioned; in others the fact emerges from a comparison of the data for different years: cf., for instance, the data on cotton weaving in Saratov Gubernia for 1879, 1890, and 1894-95. (Cf. Chapter VI, § II, 1.)—Sinzheimer (Ueber die Grenzen der Weiterbildung des fabrikm\"assigen Grossbetriebes in Deutschland, Stuttgart, 1893) [On the Limits of Extension of Large-Scale Factory Production in Germany, Stuttgart, 1893. –Ed.] classifies under large factories enterprises with 50 and more workers. We do not think this standard low, but owing to the difficulties involved in calculating Russian data, we have had to limit ourselves to the largest factories.—Lenin
[2] Thus, in 1866, category A included 17 sugar-refineries, where the average annual output per worker was about 6,000 rubles, whereas in the textile factories (included in the top categories) the average annual output per worker ranged from 500 to 1,500 rubles.—Lenin
[3] The total figures for our factory industry as given by the Directory and the List were quoted above, in § II [Cf. Studies, p. 276 (See present edition, Vol. 4 “On the Question of Our Factory Statistics.” –Ed.)]. We would point out that the rise in the percentage of large factories in the total number of “factories and works” indicates above all that this latter term is gradually acquiring a more restricted meaning in our statistics.—Lenin
[4] These data have been compiled from Statistical Returns for the Mining and Metallurgical Industries. In 1890, enterprises enumerated in the Directory having been excluded. By this exclusion, the total number of mining workers in European Russia is reduced by 35,000 (340,000-35,000 = 305,000).—Lenin
[5] The industrial census for 1895 for the whole of German industry, including mine development, which is not registered in Russia, recorded a total of 248 establishments with 1,000 and more workers; the aggregate number of workers in these establishments was 430,286. Hence, the largest factories in Russia are larger than those in Germany.—Lenin
[6] Russkoye Bogatstvo, 1894, No. 6, p. 101 and foll. The data for large factories which we have given above also indicate a lower percentage of growth in 1879-1890 as compared with 1866-1879.—Lenin
[7] As Mr. Tugan-Baranovsky, for example, did in his Factory, p. 307 and chart. The chart clearly shows that 1879, and especially 1880 and 1881, were years of particular boom.—Lenin
[8] See, for instance, felt cloth production— increased output of army cloth; tanning—enormous activity, leather goods— a large factory produces goods to the amount of 2.5 million rubles “for the War Department” (p. 288). The Izhevsk and the Sestroretsk works turn out artillery supplies to the value of 7 1/2 million rubles, as against 1 1/4 million rubles in 1890. In copper-working one notes the production of supplies for the troops and of military instruments pp. 388-389); explosive factories work at full capacity, etc.—Lenin
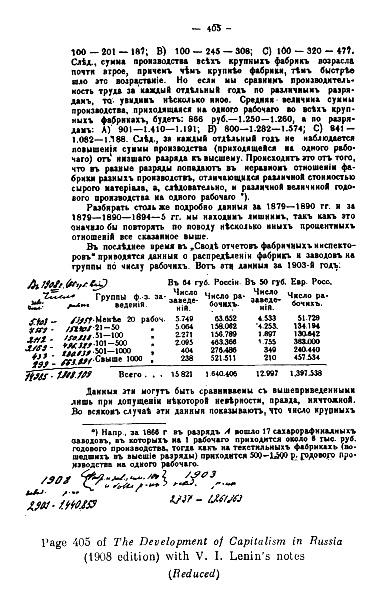
[9] 154: Lenin supplemented this table later with the corresponding figures for 1908 (see illustration on p. 513). The data entered by Lenin were taken from Collection of Factory Inspectors’ Reports for 1908 (no. 50-51), published in 1910. Consequently. Lenin’s entries were made either in 1910 or in 1911. [p. 512]
| | |
| | | | | | |